Managing Data
The main entry point for browsing all data in the system is the Browse Data menu item under Data Management:

Data in Scifeon are categorized into the following categories:
- Custom - Custom data types created by customer apps installed in the system
- Stuff - This is representing physical stuff in the lab, such as samples, plates, etc.
- Biology - This is representing biological data, such as sequences, plasmids, etc.
- Results - This is representing different result types from experiments, such as measurements, images, etc.
- Workflow - This is representing workflow data, such as experiments, steps, procedures, etc.
- Other - This is representing other data types, such as users, projects, etc. Mainly entities that are system related.
These entities can be browsed individually by clicking each of the entity names. The browsing of each entity can be seen as browsing the raw file system in Windows: this is as close as you get to browsing the data directly in the database.
Searching
Section titled “Searching”The navigation side-bar includes two ways of searching:
- Quick search always accessible
- Search from the menu tab
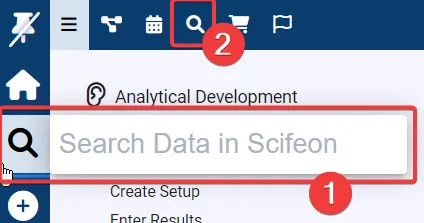
These search field (1) are searching across all entities in the system, and the search results (2) are shown close to the search field (1). Data searched are names, descriptions, titles, notes in experiments, messages, barcodes, etc.

Clicking a search result will take you to the page with more details on the data. The search results are also available in the Search tab (2) in the menu bar.
List Views
Section titled “List Views”The list views are the main way of browsing data in Scifeon. The list views are available for all entities in the system. Click an entity on the Browse Data page and see the list view, e.g. for Samples:
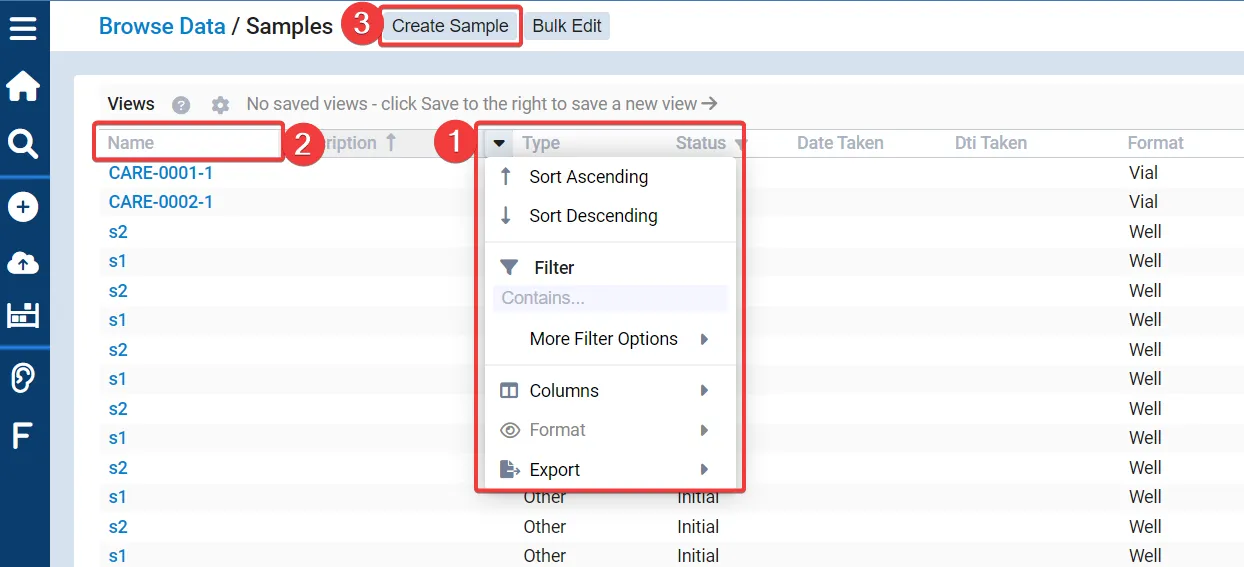
Here you can see the list of samples in the system. Click the arrow (1) on the column headers that become visible when hovering to see the options for each column:
- Sorting - click to sort the list by this column.
- Filtering - use the primary filter or see the advanced filter options by hovering the More Filter Options menu.
- Add columns - add columns by hovering Columns.
- Exporting - export the list to Excel, CSV, etc.
Saved Views
Section titled “Saved Views”The Views-bar, located at the top of all accessible lists under the Data Management > Browse Data menu, significantly improves the way you interact with your data.
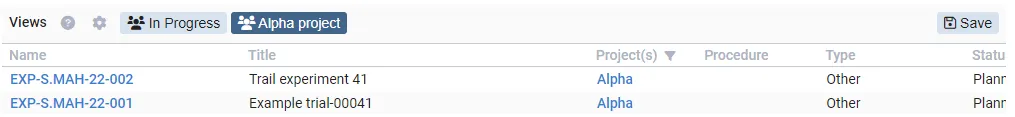
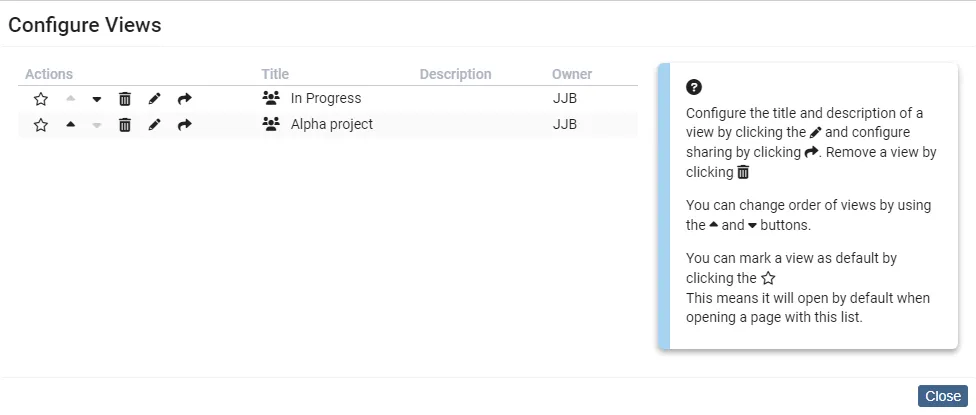
The Views-bar comprises essential elements, including a Help and Configure icon, your saved views, and a Save button. When filters, sorting options, or visible columns are applied, you can conveniently save the newly configured view using the Save button. Moreover, these views can be easily shared with your colleagues, allowing for seamless collaboration and knowledge exchange. Share views collectively, individually, by project, or even by department, ensuring effective communication within your research team.

Additionally, the configuration enable you to customize the order of the views according to your preferences. You even have the flexibility to set a specific view as your default, which will automatically appear when loading the list page in the future. This personalized experience streamlines your workflow and saves you valuable time when accessing relevant information.
Discover the power of the Views-bar in Scifeon, empowering you to efficiently manage and share your scientific data like never before. If you would like to see the Views-bar atop a list another place in Scifeon, don’t hesitate to reach out to us by email support@scifeon.com or by clicking the Feedback-button on your right.
Joining data
Section titled “Joining data”Below the columns options > Columns > Advanced you can join data from other entities to the current list view.
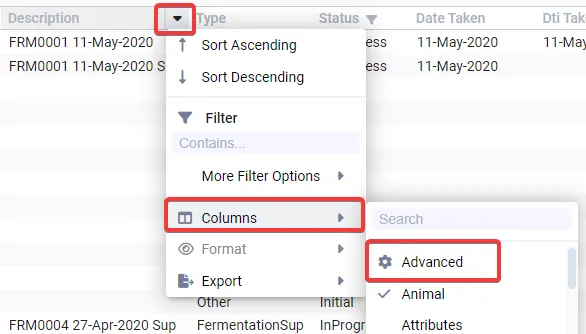
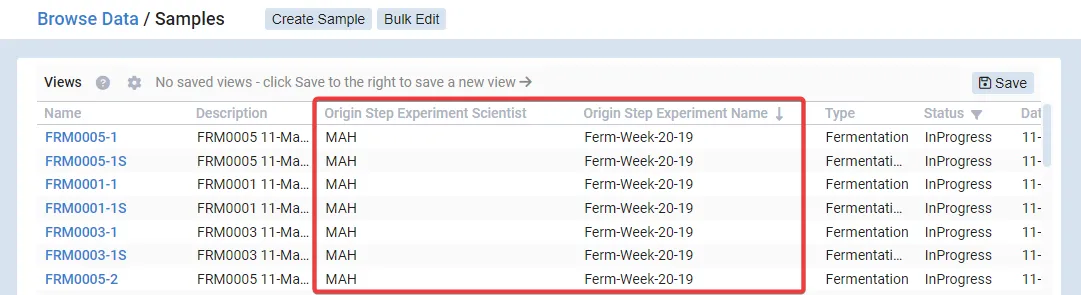
This is done by selecting the entity you want to join from the drop-down menu, and then selecting the property you want to join on. For instance, in a Sample-list, you can now view the name and scientist of the Experiment from which the Sample originates:
Exporting data
Section titled “Exporting data”Refer to the User Guides > Using Data > Exporting from lists page for more information about exporting data from lists.
Viewing data
Section titled “Viewing data”The Entity Detail Page (EDP) is the page where you can view all the details of a specific entity. The EDP is accessed by clicking an entity in a list view, or by clicking a name of an entity in other parts of the system. The EDP is divided into three sections:
- Header - The header contains the name, etc. of the entity. The header also contains the Actions button, which is a drop-down menu with actions that can be performed on the entity. The actions available are different for each entity, and can be configured by the system administrator.
- Left side-bar - This includes more detailed properties of the entity.
- Content - This varies greatly from entity to entity, but for Samples it could be related results, for Procedures the related experiments, etc.
- Tabs - This always include an Activity Log and Messages.

Properties of entities can be added as Data Manager using this guide, or by adding a custom app. At the moment new entity classes can only be added by adding a custom app to the system.
Configure Entity Detail Page
Section titled “Configure Entity Detail Page”As a Data Manager it is possible to configure the items seen on the entity detail page. This is done by configuring the entity detail page and adding or removing the desired items: click the dot-menu in the upper-right corner:

Here you can edit existing configurations or create new ones. A configuration is matched against the entity type and the entity instance, and the first matching configuration is used. If no configuration is found, the default configuration is used.
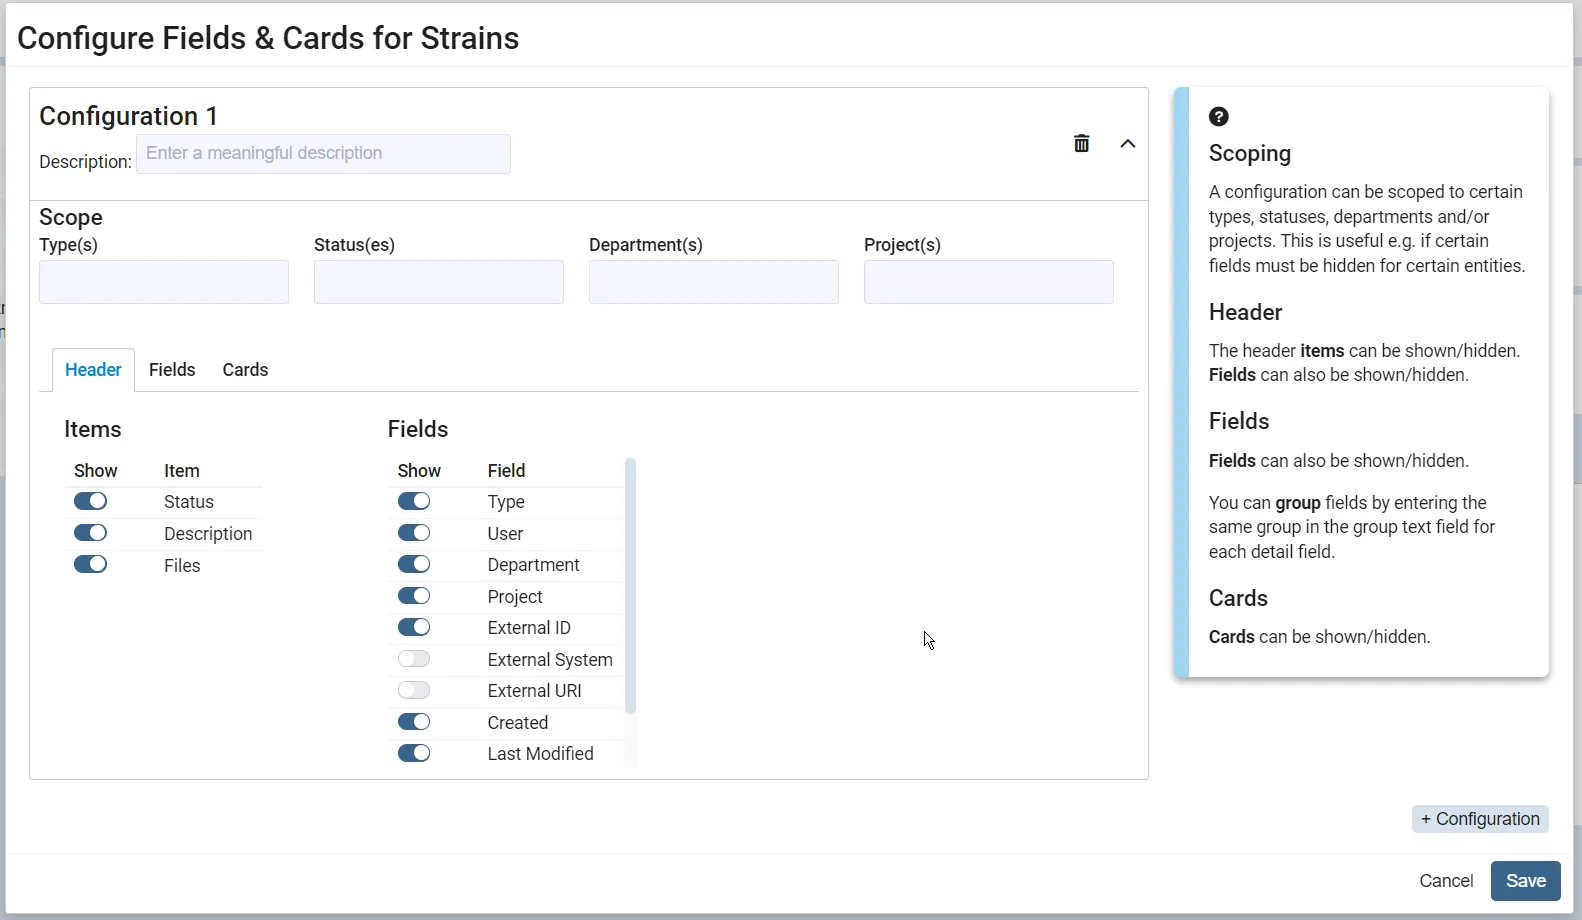
For each configuration you can set these properties:
- Header: these fields are shown at the top of the page.
- Fields: these fields are shown in some of the cards.
- Cards: these cards are shown in the middle of the page. These typically include more detailed information.

Visualize Data Relations
Section titled “Visualize Data Relations”To get a better understanding of how entities relate to each you can visualize entities in the Context Browser.
Refer to the User Guides > Managing Data > Context Browser page for more information about viewing data relations.
Creating data
Section titled “Creating data”The simplest way of creating new data is through the Create {Entity} (3) button on top of the list view on the browse pages.
This take you to the create page for the entity, where you can fill out the required fields and save the data.

This is the simplest way of creating data, but it is also possible to create data from other places in the system, such as from an experiment, etc. The create view is the same as the EDP view, but with all fields editable. Add the desired information and click Save in the upper-right corner.
Importing data
Section titled “Importing data”Refer to the Import Templates page for more information about importing data from e.g. instrument files, that cannot be manipulated before upload.
Importing from predefined Excel-templates: Coming soon.
Bulk editing
Section titled “Bulk editing”Refer to the User Guides > Managing Data > Bulk Create Entities page for more information about bulk creating data.
Next step
Section titled “Next step”On the next page you will find information about the ELN: Go to ELN